Stressor-Response
Seven distinct steps are involved in using stressor-response models to derive NNC:
- Identify variables for analysis based on linkages described in the conceptual model.
- Assemble available data on selected variables.
- Explore relationships across variables.
- Classify water bodies into groups in which stressor-response relationships are expected to be similar.
- Estimate stressor-response relationships within each group.
- Derive criteria based on the characteristics of the estimated relationship.
- Review, evaluate, and document analysis.
Step 1: Identify Variables for Analysis
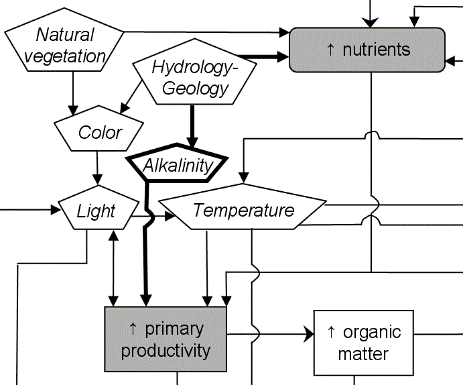
Conceptual models developed during problem formulation represent the known relationships between increased levels of nutrients, ecological effects, and support for designated uses. Pathways describing these relationships can be simple (e.g., increased nutrient levels cause increased primary productivity) or they can involve many distinct steps (e.g., increased nutrient levels increase phytoplankton abundance in lakes, reducing available light, extirpating submerged macrophytes, and reducing available littoral habitat for juvenile fish and aquatic invertebrates). Regardless of the complexity of the relationship, the conceptual model provides insight into the variables that should be included in the stressor-response analysis. More specifically, the model structure and the linkages between variables can identify primary and classification variables.
Primary variables
Primary variables quantify the stressors and the responses in the analysis. In the context of deriving nutrient criteria, stressor variables are typically selected as nutrient concentrations (e.g., TN, TP). In some situations, however, other variables provide a more direct linkage to the chosen response variable. For example, increased nutrient loading increases organic matter in a lake, and the decomposition of that organic matter can cause hypoxia. In that case, the concentration of organic matter might be the more informative stressor variable. Response variables quantify or link directly to assessment endpoints. For example, a common assessment endpoint would be the health of the biological community, and the response variable could be a fish or an invertebrate index that quantifies the health of the community. In other cases, the response variable might quantify a stressor that arises directly from elevated concentrations of nutrients. For example, the extent of hypoxia in a lake is directly linked to the supply of organic material, part of which derives from primary productivity. That means you could use hypoxic extent as a response variable.
Classification variables

Figure 1. Example of alternate path connecting increased levels of nutrients to increased primary productivity.
Other classification variables could be identified from an understanding of the processes by which elevated concentrations of nutrients are manifested as ecological effects. For example, the strength of stratification in a lake controls the rate at which oxygen can be diffused to deeper waters. That means stratification strength would potentially be a useful classification variable when you are modeling the relationship between nutrient levels and lake hypoxia.
